> ## Documentation Index
> Fetch the complete documentation index at: https://openrouter.ai/docs/llms.txt
> Use this file to discover all available pages before exploring further.
# S3 / S3-Compatible
> Send traces to Amazon S3 or S3-compatible storage
[Amazon S3](https://aws.amazon.com/s3/) is a scalable object storage service. OpenRouter can send traces to any S3-compatible storage, including AWS S3, Cloudflare R2, MinIO, and other compatible services.
## Step 1: Create an S3 bucket and credentials
In your cloud provider's console, create a bucket for storing traces and generate access credentials with write permissions to the bucket.
For AWS S3:
1. Create a new S3 bucket or use an existing one
2. Go to **IAM > Users** and create a new user with programmatic access
3. Attach a policy that allows `s3:PutObject` on your bucket
4. Copy the Access Key ID and Secret Access Key
For Cloudflare R2:
1. Create a new R2 bucket in your Cloudflare dashboard
2. Go to **R2 > Manage R2 API Tokens** and create a new token with write permissions
3. Copy the Access Key ID, Secret Access Key, and your account's S3 endpoint
## Step 2: Enable Broadcast in OpenRouter
Go to [Settings > Observability](https://openrouter.ai/settings/observability) and toggle **Enable Broadcast**.
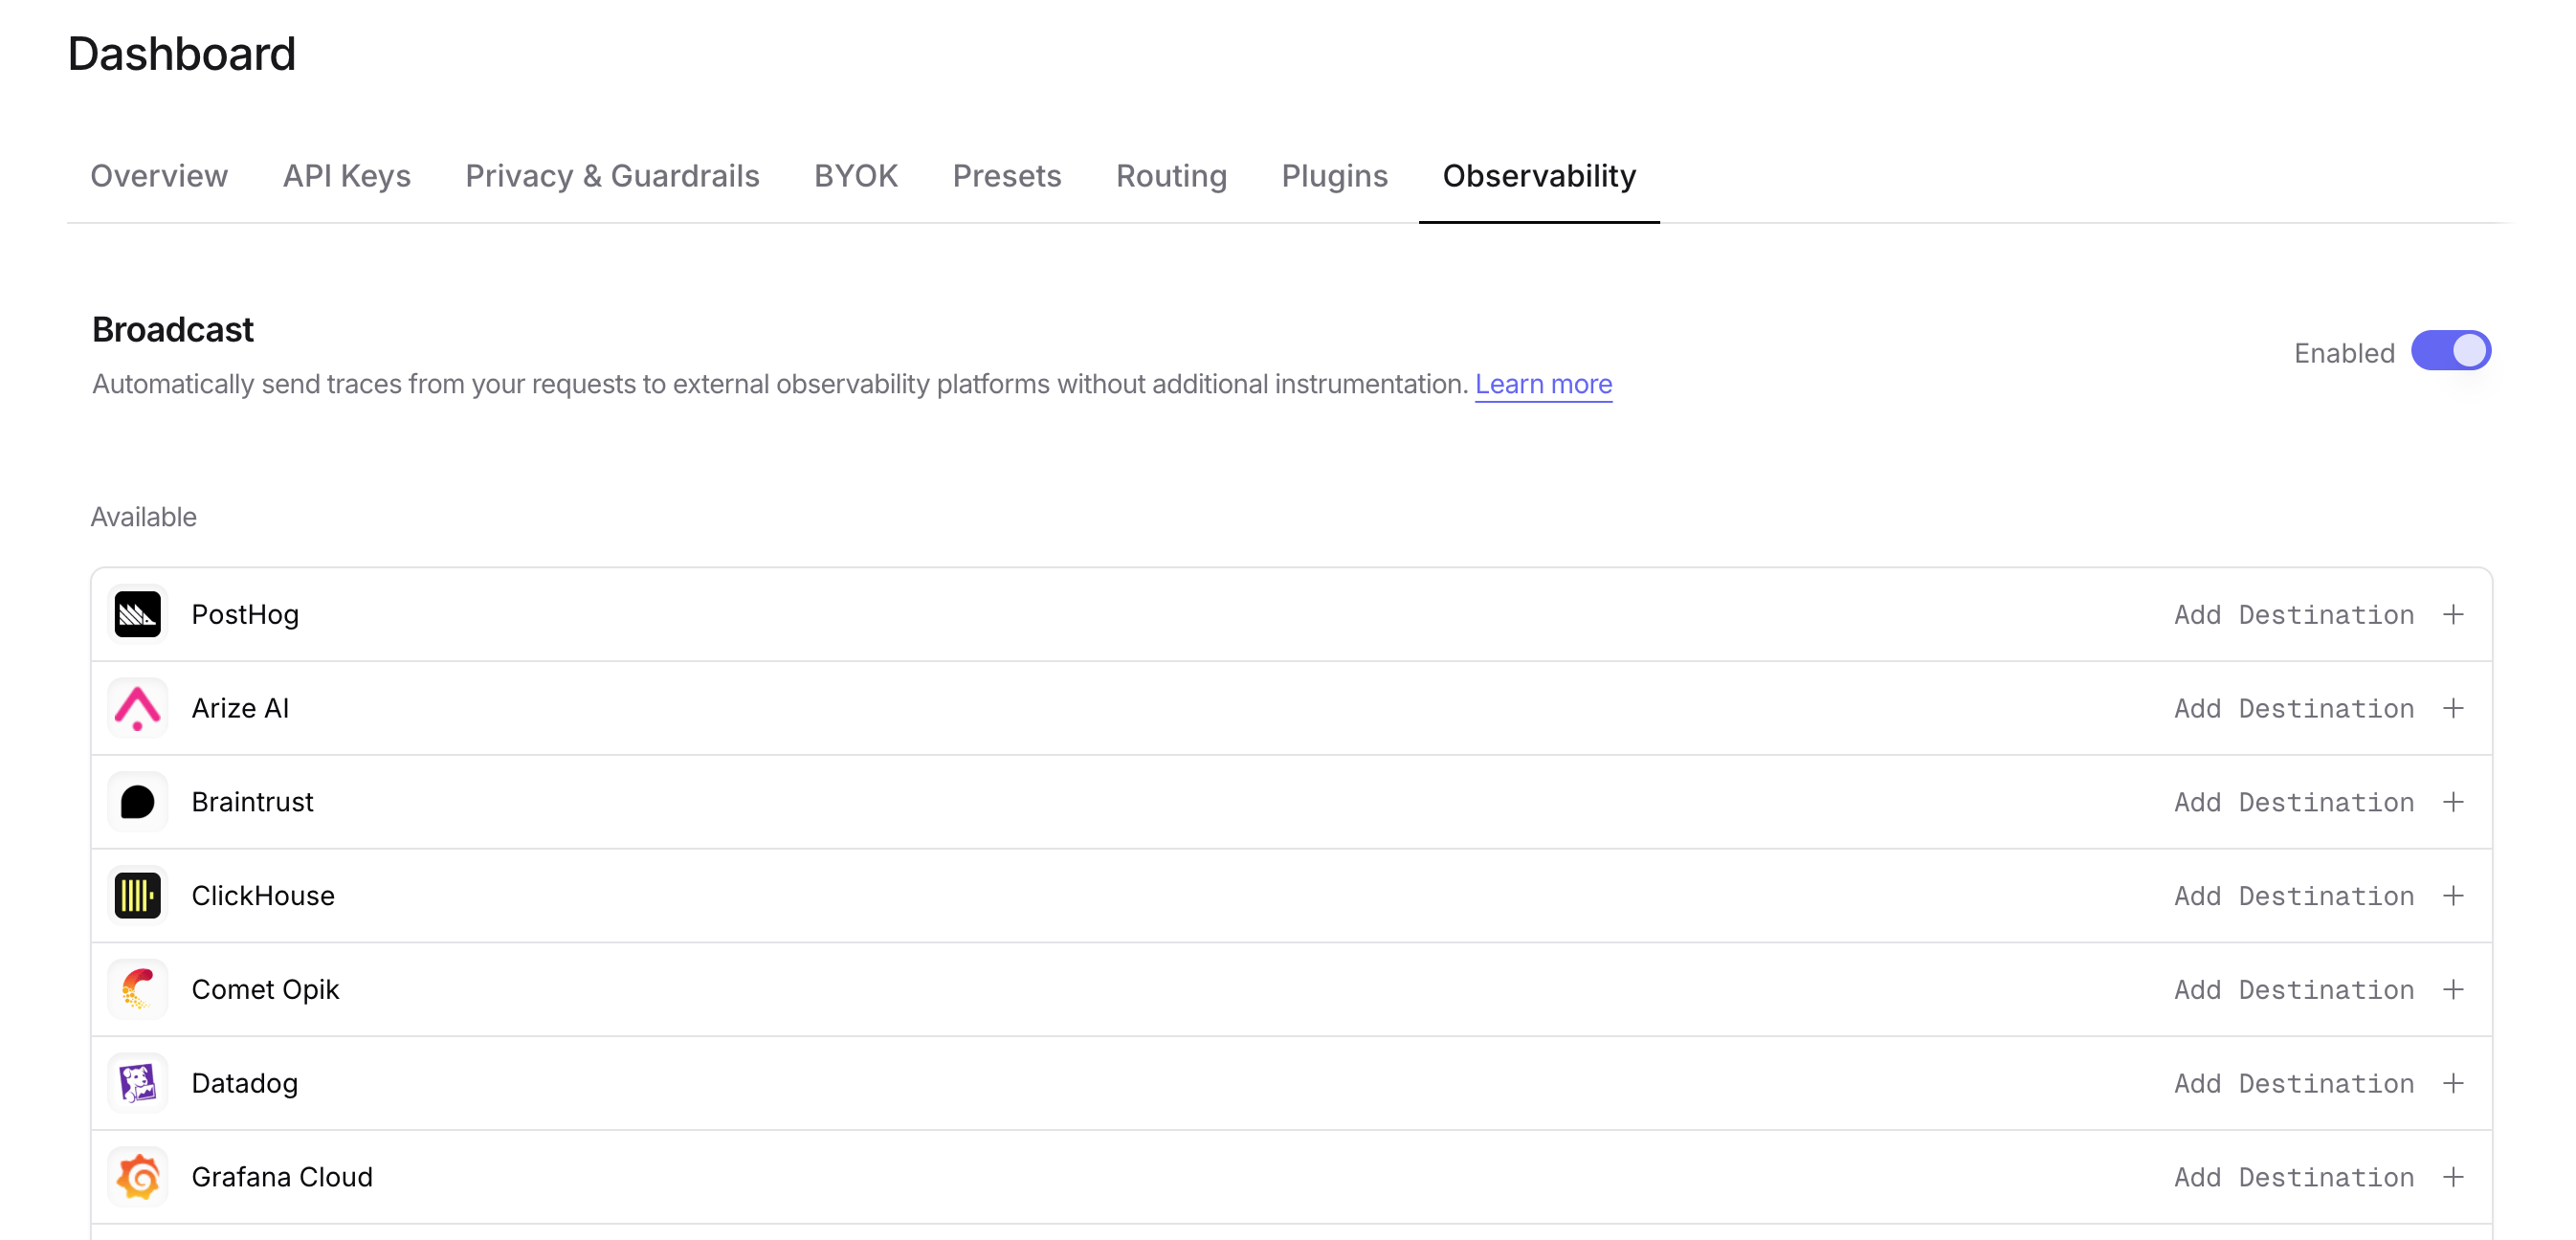 ## Step 3: Configure S3
Click the edit icon next to **S3 / S3-Compatible** and enter:
* **Bucket Name**: Your S3 bucket name (e.g., `my-traces-bucket`)
* **Region** (optional): AWS region (auto-detected for AWS, required for some S3-compatible services)
* **Custom Endpoint** (optional): For S3-compatible services like R2, enter the endpoint URL (e.g., `https://your-account-id.r2.cloudflarestorage.com`)
* **Access Key Id**: Your access key ID
* **Secret Access Key**: Your secret access key
* **Session Token** (optional): For temporary credentials
* **Path Template** (optional): Customize the object path. Default is `openrouter-traces/{date}`. Available variables: `{prefix}`, `{date}`, `{year}`, `{month}`, `{day}`, `{apiKeyName}`
## Step 4: Test and save
Click **Test Connection** to verify the setup. The configuration only saves if the test passes.
## Step 5: Send a test trace
Make an API request through OpenRouter and check your S3 bucket for the trace file. Each trace is saved as a separate JSON file with the format `{traceId}-{timestamp}.json`.
## Path template examples
Customize how traces are organized in your bucket:
* `openrouter-traces/{date}` - Default, organizes by date (e.g., `openrouter-traces/2024-01-15/abc123-1705312800.json`)
* `traces/{year}/{month}/{day}` - Hierarchical date structure
* `{apiKeyName}/{date}` - Organize by API key name, then date
* `production/llm-traces/{date}` - Custom prefix for environment separation
For time-based batching (e.g., hourly or daily aggregated files), consider using AWS Kinesis Firehose instead, which buffers records and writes batched files to S3.
## Custom Metadata
Custom metadata from the `trace` field is included in the JSON trace file stored in your S3 bucket. The metadata is available in the `metadata` field of each observation within the trace.
### Supported Metadata Keys
| Key | S3 JSON Mapping | Description |
| ----------------- | -------------------------- | --------------------------- |
| `trace_id` | `id` (trace level) | Custom trace identifier |
| `trace_name` | `name` (trace level) | Custom name for the trace |
| `span_name` | `name` (observation level) | Name for intermediate spans |
| `generation_name` | `name` (observation level) | Name for the LLM generation |
### Example
```json lines theme={null}
{
"model": "openai/gpt-4o",
"messages": [{ "role": "user", "content": "Analyze this document..." }],
"user": "user_12345",
"session_id": "session_abc",
"trace": {
"trace_name": "Document Analysis",
"generation_name": "Extract Key Points",
"document_type": "contract",
"batch_id": "batch_456"
}
}
```
### Accessing Metadata in S3
Each trace file is a JSON object. Custom metadata keys from `trace` are stored in the `metadata` field and can be queried using tools like Amazon Athena, Presto, or any JSON-aware query engine:
```sql lines theme={null}
-- Example Athena query on S3 trace files
SELECT
json_extract_scalar(metadata, '$.document_type') as doc_type,
json_extract_scalar(metadata, '$.batch_id') as batch_id
FROM openrouter_traces
WHERE json_extract_scalar(metadata, '$.document_type') = 'contract';
```
### Additional Context
* The `user` field maps to `userId` in the trace JSON
* The `session_id` field maps to `sessionId` in the trace JSON
* Trace files include full input/output messages, token counts, costs, and timing data alongside your custom metadata
## Billing quantities
For a single-trace file, cache-write details live under `trace.observations[].promptTokensDetails`. With the **Cost** metadata opt-in enabled, the generation quantities also appear under `trace.metadata.openrouter_generation` and the generation observation's `metadata.openrouter_generation`.
For example, the generation metadata may contain:
```json theme={null}
{
"is_byok": true,
"cache_write_tokens": 300,
"cache_creation": {
"ephemeral_5m_input_tokens": 100,
"ephemeral_1h_input_tokens": 200
},
"native_server_tool_use": {
"web_search_requests": 1,
"web_fetch_requests": 0,
"code_execution_requests": 2
},
"usage_is_estimated": false
}
```
Batch files use `traces[]` instead of `trace`. Read each generation once. These representations repeat the same generation quantities; do not add them together. Null or omitted values are unavailable, while an explicit zero is a reported or observed zero. See [Token and cost fields](/docs/guides/features/broadcast#token-and-cost-fields) for estimation, TTL availability, and provider billing caveats.
### Raw provider usage
The same metadata locations carry [`upstream_raw_response_usage`](/docs/guides/features/broadcast#raw-provider-usage) as ordinary JSON, so no additional decoding step is needed:
```json theme={null}
{
"upstream_raw_response_usage": {
"input_tokens": 4,
"output_tokens": 373,
"cache_creation_input_tokens": 300,
"cache_read_input_tokens": 0,
"cache_creation": {
"ephemeral_5m_input_tokens": 100,
"ephemeral_1h_input_tokens": 200
}
}
}
```
The value can also be an array of usage reports or `null`, and its keys are the provider's own. Query it with a JSON-aware engine rather than a fixed column list, for example `json_extract(metadata, '$.openrouter_generation.upstream_raw_response_usage')` in Athena. When it is `null`, check `upstream_raw_response_usage_suppression_reason` to distinguish suppression from unavailable usage.
## Privacy Mode
When [Privacy Mode](/docs/guides/features/broadcast#privacy-mode) is enabled for this destination, prompt and completion content is excluded from traces. All other trace data (token usage, costs, timing, model information, and custom metadata) is still sent normally. Raw provider usage is replaced with `null` and reported as `privacy_mode`, because a provider's usage object can contain arbitrary future fields. See [Privacy Mode](/docs/guides/features/broadcast#privacy-mode) for details.
## Step 3: Configure S3
Click the edit icon next to **S3 / S3-Compatible** and enter:
* **Bucket Name**: Your S3 bucket name (e.g., `my-traces-bucket`)
* **Region** (optional): AWS region (auto-detected for AWS, required for some S3-compatible services)
* **Custom Endpoint** (optional): For S3-compatible services like R2, enter the endpoint URL (e.g., `https://your-account-id.r2.cloudflarestorage.com`)
* **Access Key Id**: Your access key ID
* **Secret Access Key**: Your secret access key
* **Session Token** (optional): For temporary credentials
* **Path Template** (optional): Customize the object path. Default is `openrouter-traces/{date}`. Available variables: `{prefix}`, `{date}`, `{year}`, `{month}`, `{day}`, `{apiKeyName}`
## Step 4: Test and save
Click **Test Connection** to verify the setup. The configuration only saves if the test passes.
## Step 5: Send a test trace
Make an API request through OpenRouter and check your S3 bucket for the trace file. Each trace is saved as a separate JSON file with the format `{traceId}-{timestamp}.json`.
## Path template examples
Customize how traces are organized in your bucket:
* `openrouter-traces/{date}` - Default, organizes by date (e.g., `openrouter-traces/2024-01-15/abc123-1705312800.json`)
* `traces/{year}/{month}/{day}` - Hierarchical date structure
* `{apiKeyName}/{date}` - Organize by API key name, then date
* `production/llm-traces/{date}` - Custom prefix for environment separation
For time-based batching (e.g., hourly or daily aggregated files), consider using AWS Kinesis Firehose instead, which buffers records and writes batched files to S3.
## Custom Metadata
Custom metadata from the `trace` field is included in the JSON trace file stored in your S3 bucket. The metadata is available in the `metadata` field of each observation within the trace.
### Supported Metadata Keys
| Key | S3 JSON Mapping | Description |
| ----------------- | -------------------------- | --------------------------- |
| `trace_id` | `id` (trace level) | Custom trace identifier |
| `trace_name` | `name` (trace level) | Custom name for the trace |
| `span_name` | `name` (observation level) | Name for intermediate spans |
| `generation_name` | `name` (observation level) | Name for the LLM generation |
### Example
```json lines theme={null}
{
"model": "openai/gpt-4o",
"messages": [{ "role": "user", "content": "Analyze this document..." }],
"user": "user_12345",
"session_id": "session_abc",
"trace": {
"trace_name": "Document Analysis",
"generation_name": "Extract Key Points",
"document_type": "contract",
"batch_id": "batch_456"
}
}
```
### Accessing Metadata in S3
Each trace file is a JSON object. Custom metadata keys from `trace` are stored in the `metadata` field and can be queried using tools like Amazon Athena, Presto, or any JSON-aware query engine:
```sql lines theme={null}
-- Example Athena query on S3 trace files
SELECT
json_extract_scalar(metadata, '$.document_type') as doc_type,
json_extract_scalar(metadata, '$.batch_id') as batch_id
FROM openrouter_traces
WHERE json_extract_scalar(metadata, '$.document_type') = 'contract';
```
### Additional Context
* The `user` field maps to `userId` in the trace JSON
* The `session_id` field maps to `sessionId` in the trace JSON
* Trace files include full input/output messages, token counts, costs, and timing data alongside your custom metadata
## Billing quantities
For a single-trace file, cache-write details live under `trace.observations[].promptTokensDetails`. With the **Cost** metadata opt-in enabled, the generation quantities also appear under `trace.metadata.openrouter_generation` and the generation observation's `metadata.openrouter_generation`.
For example, the generation metadata may contain:
```json theme={null}
{
"is_byok": true,
"cache_write_tokens": 300,
"cache_creation": {
"ephemeral_5m_input_tokens": 100,
"ephemeral_1h_input_tokens": 200
},
"native_server_tool_use": {
"web_search_requests": 1,
"web_fetch_requests": 0,
"code_execution_requests": 2
},
"usage_is_estimated": false
}
```
Batch files use `traces[]` instead of `trace`. Read each generation once. These representations repeat the same generation quantities; do not add them together. Null or omitted values are unavailable, while an explicit zero is a reported or observed zero. See [Token and cost fields](/docs/guides/features/broadcast#token-and-cost-fields) for estimation, TTL availability, and provider billing caveats.
### Raw provider usage
The same metadata locations carry [`upstream_raw_response_usage`](/docs/guides/features/broadcast#raw-provider-usage) as ordinary JSON, so no additional decoding step is needed:
```json theme={null}
{
"upstream_raw_response_usage": {
"input_tokens": 4,
"output_tokens": 373,
"cache_creation_input_tokens": 300,
"cache_read_input_tokens": 0,
"cache_creation": {
"ephemeral_5m_input_tokens": 100,
"ephemeral_1h_input_tokens": 200
}
}
}
```
The value can also be an array of usage reports or `null`, and its keys are the provider's own. Query it with a JSON-aware engine rather than a fixed column list, for example `json_extract(metadata, '$.openrouter_generation.upstream_raw_response_usage')` in Athena. When it is `null`, check `upstream_raw_response_usage_suppression_reason` to distinguish suppression from unavailable usage.
## Privacy Mode
When [Privacy Mode](/docs/guides/features/broadcast#privacy-mode) is enabled for this destination, prompt and completion content is excluded from traces. All other trace data (token usage, costs, timing, model information, and custom metadata) is still sent normally. Raw provider usage is replaced with `null` and reported as `privacy_mode`, because a provider's usage object can contain arbitrary future fields. See [Privacy Mode](/docs/guides/features/broadcast#privacy-mode) for details.