> ## Documentation Index
> Fetch the complete documentation index at: https://openrouter.ai/docs/llms.txt
> Use this file to discover all available pages before exploring further.
# OpenTelemetry Collector
> Send traces to any OpenTelemetry-compatible backend
[OpenTelemetry](https://opentelemetry.io/) is an open-source observability framework for collecting, processing, and exporting telemetry data. OpenRouter can send traces to any backend that supports the OpenTelemetry Protocol (OTLP), including Axiom, Jaeger, Grafana Tempo, and self-hosted collectors.
## Step 1: Get your OTLP endpoint and credentials
Set up your OpenTelemetry-compatible backend and obtain the OTLP traces endpoint URL along with any required authentication headers.
For Axiom:
1. Create an Axiom account and dataset
2. Go to **Settings > API Tokens** and create a new token
3. Your endpoint is `https://api.axiom.co/v1/traces`
4. You'll need headers: `Authorization: Bearer xaat-xxx` and `X-Axiom-Dataset: your-dataset`
For self-hosted collectors:
1. Deploy an OpenTelemetry Collector with an OTLP receiver
2. Configure the receiver to listen on a publicly accessible endpoint
3. Note the endpoint URL (typically ending in `/v1/traces`)
## Step 2: Enable Broadcast in OpenRouter
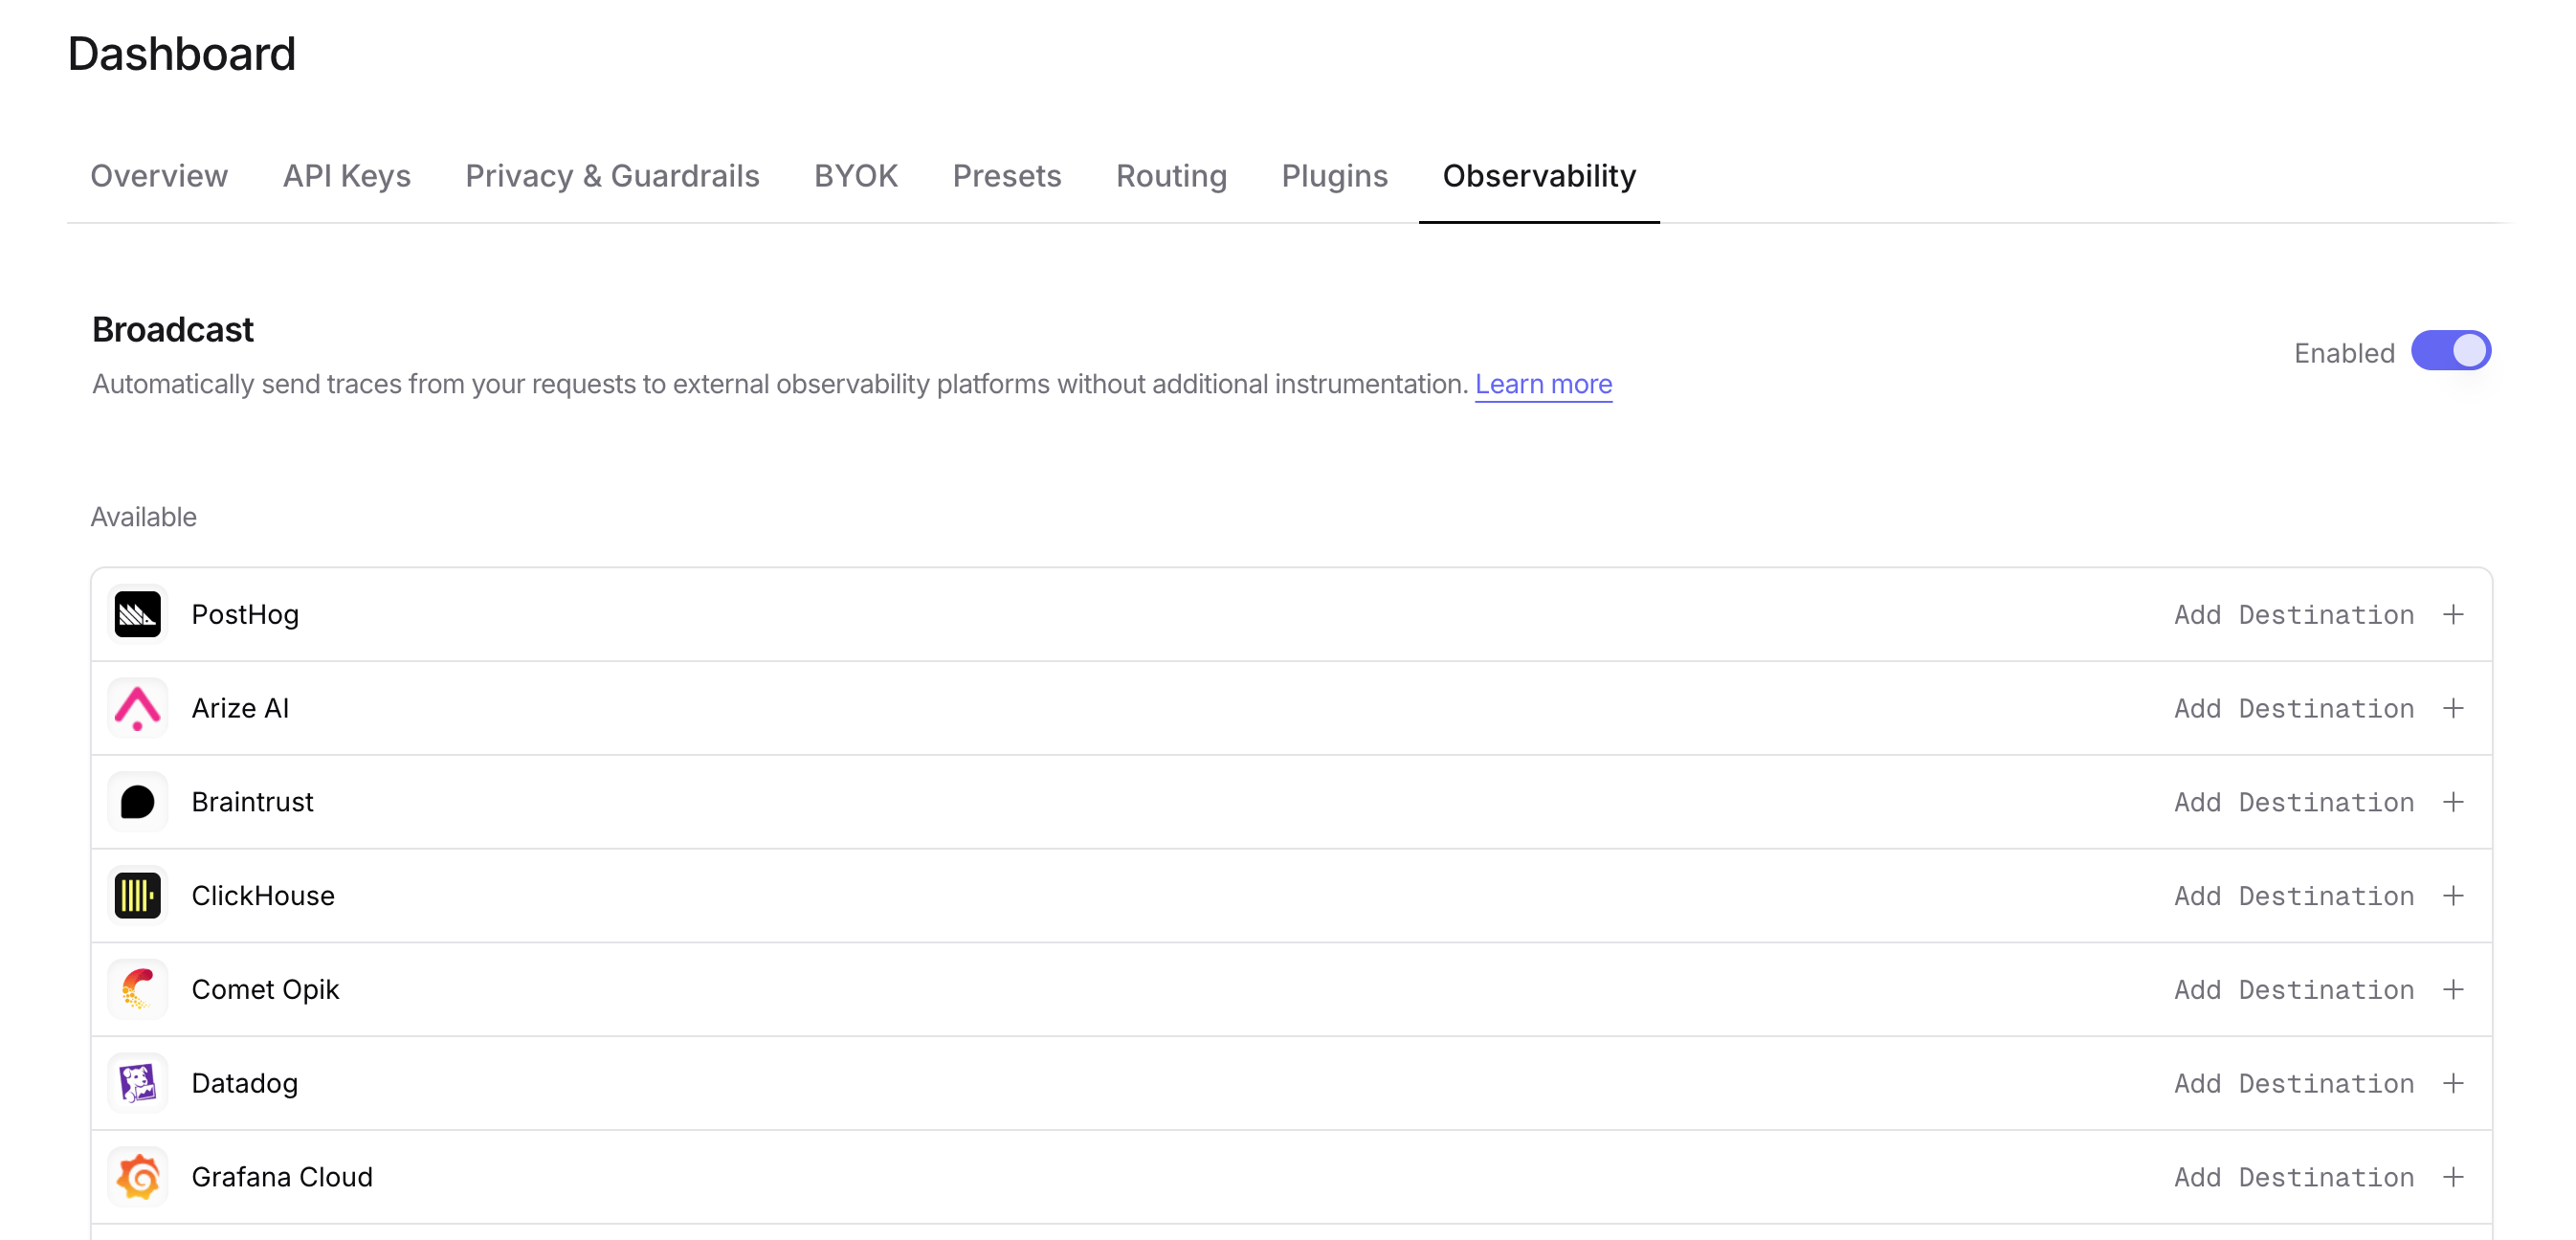
Go to [Settings > Observability](https://openrouter.ai/settings/observability) and toggle **Enable Broadcast**.
 ## Step 3: Configure OpenTelemetry Collector
Click the edit icon next to **OpenTelemetry Collector** and enter:
* **Endpoint**: Your OTLP traces endpoint URL (e.g., `https://api.axiom.co/v1/traces` or `https://your-collector.example.com:4318/v1/traces`)
* **Headers** (optional): Custom HTTP headers as a JSON object for authentication
Example headers for Axiom:
```json lines theme={null}
{
"Authorization": "Bearer xaat-your-token",
"X-Axiom-Dataset": "your-dataset"
}
```
Example headers for authenticated collectors:
```json lines theme={null}
{
"Authorization": "Bearer your-token",
"X-Custom-Header": "value"
}
```
## Step 4: Test and save
Click **Test Connection** to verify the setup. The configuration only saves if the test passes.
## Step 5: Send a test trace
Make an API request through OpenRouter and view the trace in your OpenTelemetry backend.
## Compatible backends
The OpenTelemetry Collector destination works with any backend that supports OTLP over HTTP, including:
* **Axiom** - Cloud-native log and trace management
* **Jaeger** - Distributed tracing platform
* **Grafana Tempo** - High-scale distributed tracing backend
* **Honeycomb** - Observability for distributed systems
* **Lightstep** - Cloud-native observability platform
* **Self-hosted OpenTelemetry Collector** - Route traces to multiple backends
OpenRouter sends traces using the OTLP/HTTP protocol with JSON encoding. Ensure your collector or backend is configured to accept OTLP over HTTP on the `/v1/traces` path.
## Custom Metadata
Custom metadata from the `trace` field is sent as span attributes in the OTLP payload. How this metadata appears depends on your downstream backend.
### Supported Metadata Keys
| Key | OTLP Mapping | Description |
| ----------------- | -------------- | ------------------------------------------------ |
| `trace_id` | Trace ID | Group multiple requests into a single trace |
| `trace_name` | Span Name | Custom name for the root span |
| `span_name` | Span Name | Name for intermediate spans in the hierarchy |
| `generation_name` | Span Name | Name for the LLM generation span |
| `parent_span_id` | Parent Span ID | Link to an existing span in your trace hierarchy |
### Example
```json lines theme={null}
{
"model": "openai/gpt-4o",
"messages": [{ "role": "user", "content": "Hello!" }],
"user": "user_12345",
"session_id": "session_abc",
"trace": {
"trace_id": "app_trace_001",
"trace_name": "Chat Handler",
"generation_name": "Generate Response",
"environment": "staging",
"deployment": "us-east-1"
}
}
```
### Span Attributes
Custom metadata keys are included as span attributes under the `trace.metadata.*` namespace. For example, `environment` from the trace field becomes `trace.metadata.environment` in the OTLP payload.
Standard GenAI semantic conventions (`gen_ai.*`) are used for model, token usage, and cost attributes.
### Additional Context
* The `user` field maps to `user.id` in span attributes
* The `session_id` field maps to `session.id` in span attributes
* Your downstream backend determines how these attributes are indexed, queried, and displayed
* Using `parent_span_id` lets you link OpenRouter traces to your application's existing distributed traces
## Billing quantities
Cache-write details are exported as numeric attributes on the generation span:
| Attribute | Meaning |
| ------------------------------------------ | ----------------------------------------------- |
| `gen_ai.usage.input_tokens.cache_write` | Total cache-write tokens. |
| `gen_ai.usage.input_tokens.cache_write_5m` | Five-minute cache-write tokens, when available. |
| `gen_ai.usage.input_tokens.cache_write_1h` | One-hour cache-write tokens, when available. |
With **Cost** enabled under **Additional generation metadata**, the same quantities and native-tool counters are also queryable under `span.metadata.openrouter_generation.*`. For example:
```json theme={null}
{
"span.metadata.openrouter_generation.cache_write_tokens": 300,
"span.metadata.openrouter_generation.cache_creation.ephemeral_5m_input_tokens": 100,
"span.metadata.openrouter_generation.cache_creation.ephemeral_1h_input_tokens": 200,
"span.metadata.openrouter_generation.native_server_tool_use.web_search_requests": 1,
"span.metadata.openrouter_generation.native_server_tool_use.code_execution_requests": 2,
"span.metadata.openrouter_generation.usage_is_estimated": false
}
```
The example shows attribute values as a flat map; OTLP encodes numbers as `intValue` and the estimate flag as `boolValue`. Root spans also carry generation metadata under `trace.metadata.openrouter_generation.*`. Read each generation once. These representations repeat the same generation quantities; do not add them together. Unavailable quantities are omitted from OTEL attributes, while zero and `false` are preserved. See [Token and cost fields](/docs/guides/features/broadcast#token-and-cost-fields) for interpretation and billing caveats.
### Raw provider usage
Unlike the quantities above, [`upstream_raw_response_usage`](/docs/guides/features/broadcast#raw-provider-usage) is not flattened into one attribute per provider field. It is sent as a single `stringValue` attribute holding JSON, because its keys are provider-controlled and can change without notice:
```json theme={null}
{
"span.metadata.openrouter_generation.upstream_raw_response_usage": "{\"input_tokens\":4,\"output_tokens\":373,\"cache_creation_input_tokens\":300}"
}
```
Decode that string in your collector or query layer to read individual provider fields. The decoded value can be an object, an array of usage reports in provider order, or `null` — which is sent as the four-character string `null`, distinct from the attribute being absent. When it decodes to `null`, `upstream_raw_response_usage_suppression_reason` says whether the value was suppressed or simply unavailable.
This attribute keeps its path even when a generation carries more ordinary metadata than fits in the attribute budget. Because collectors and backends impose their own attribute value length limits, verify that your pipeline stores the complete JSON string before relying on it.
## Privacy Mode
When [Privacy Mode](/docs/guides/features/broadcast#privacy-mode) is enabled for this destination, prompt and completion content is excluded from traces. All other trace data — token usage, costs, timing, model information, and custom metadata — is still sent normally. Raw provider usage is replaced with `null` and reported as `privacy_mode`, because a provider's usage object can contain arbitrary future fields. See [Privacy Mode](/docs/guides/features/broadcast#privacy-mode) for details.
## Step 3: Configure OpenTelemetry Collector
Click the edit icon next to **OpenTelemetry Collector** and enter:
* **Endpoint**: Your OTLP traces endpoint URL (e.g., `https://api.axiom.co/v1/traces` or `https://your-collector.example.com:4318/v1/traces`)
* **Headers** (optional): Custom HTTP headers as a JSON object for authentication
Example headers for Axiom:
```json lines theme={null}
{
"Authorization": "Bearer xaat-your-token",
"X-Axiom-Dataset": "your-dataset"
}
```
Example headers for authenticated collectors:
```json lines theme={null}
{
"Authorization": "Bearer your-token",
"X-Custom-Header": "value"
}
```
## Step 4: Test and save
Click **Test Connection** to verify the setup. The configuration only saves if the test passes.
## Step 5: Send a test trace
Make an API request through OpenRouter and view the trace in your OpenTelemetry backend.
## Compatible backends
The OpenTelemetry Collector destination works with any backend that supports OTLP over HTTP, including:
* **Axiom** - Cloud-native log and trace management
* **Jaeger** - Distributed tracing platform
* **Grafana Tempo** - High-scale distributed tracing backend
* **Honeycomb** - Observability for distributed systems
* **Lightstep** - Cloud-native observability platform
* **Self-hosted OpenTelemetry Collector** - Route traces to multiple backends
OpenRouter sends traces using the OTLP/HTTP protocol with JSON encoding. Ensure your collector or backend is configured to accept OTLP over HTTP on the `/v1/traces` path.
## Custom Metadata
Custom metadata from the `trace` field is sent as span attributes in the OTLP payload. How this metadata appears depends on your downstream backend.
### Supported Metadata Keys
| Key | OTLP Mapping | Description |
| ----------------- | -------------- | ------------------------------------------------ |
| `trace_id` | Trace ID | Group multiple requests into a single trace |
| `trace_name` | Span Name | Custom name for the root span |
| `span_name` | Span Name | Name for intermediate spans in the hierarchy |
| `generation_name` | Span Name | Name for the LLM generation span |
| `parent_span_id` | Parent Span ID | Link to an existing span in your trace hierarchy |
### Example
```json lines theme={null}
{
"model": "openai/gpt-4o",
"messages": [{ "role": "user", "content": "Hello!" }],
"user": "user_12345",
"session_id": "session_abc",
"trace": {
"trace_id": "app_trace_001",
"trace_name": "Chat Handler",
"generation_name": "Generate Response",
"environment": "staging",
"deployment": "us-east-1"
}
}
```
### Span Attributes
Custom metadata keys are included as span attributes under the `trace.metadata.*` namespace. For example, `environment` from the trace field becomes `trace.metadata.environment` in the OTLP payload.
Standard GenAI semantic conventions (`gen_ai.*`) are used for model, token usage, and cost attributes.
### Additional Context
* The `user` field maps to `user.id` in span attributes
* The `session_id` field maps to `session.id` in span attributes
* Your downstream backend determines how these attributes are indexed, queried, and displayed
* Using `parent_span_id` lets you link OpenRouter traces to your application's existing distributed traces
## Billing quantities
Cache-write details are exported as numeric attributes on the generation span:
| Attribute | Meaning |
| ------------------------------------------ | ----------------------------------------------- |
| `gen_ai.usage.input_tokens.cache_write` | Total cache-write tokens. |
| `gen_ai.usage.input_tokens.cache_write_5m` | Five-minute cache-write tokens, when available. |
| `gen_ai.usage.input_tokens.cache_write_1h` | One-hour cache-write tokens, when available. |
With **Cost** enabled under **Additional generation metadata**, the same quantities and native-tool counters are also queryable under `span.metadata.openrouter_generation.*`. For example:
```json theme={null}
{
"span.metadata.openrouter_generation.cache_write_tokens": 300,
"span.metadata.openrouter_generation.cache_creation.ephemeral_5m_input_tokens": 100,
"span.metadata.openrouter_generation.cache_creation.ephemeral_1h_input_tokens": 200,
"span.metadata.openrouter_generation.native_server_tool_use.web_search_requests": 1,
"span.metadata.openrouter_generation.native_server_tool_use.code_execution_requests": 2,
"span.metadata.openrouter_generation.usage_is_estimated": false
}
```
The example shows attribute values as a flat map; OTLP encodes numbers as `intValue` and the estimate flag as `boolValue`. Root spans also carry generation metadata under `trace.metadata.openrouter_generation.*`. Read each generation once. These representations repeat the same generation quantities; do not add them together. Unavailable quantities are omitted from OTEL attributes, while zero and `false` are preserved. See [Token and cost fields](/docs/guides/features/broadcast#token-and-cost-fields) for interpretation and billing caveats.
### Raw provider usage
Unlike the quantities above, [`upstream_raw_response_usage`](/docs/guides/features/broadcast#raw-provider-usage) is not flattened into one attribute per provider field. It is sent as a single `stringValue` attribute holding JSON, because its keys are provider-controlled and can change without notice:
```json theme={null}
{
"span.metadata.openrouter_generation.upstream_raw_response_usage": "{\"input_tokens\":4,\"output_tokens\":373,\"cache_creation_input_tokens\":300}"
}
```
Decode that string in your collector or query layer to read individual provider fields. The decoded value can be an object, an array of usage reports in provider order, or `null` — which is sent as the four-character string `null`, distinct from the attribute being absent. When it decodes to `null`, `upstream_raw_response_usage_suppression_reason` says whether the value was suppressed or simply unavailable.
This attribute keeps its path even when a generation carries more ordinary metadata than fits in the attribute budget. Because collectors and backends impose their own attribute value length limits, verify that your pipeline stores the complete JSON string before relying on it.
## Privacy Mode
When [Privacy Mode](/docs/guides/features/broadcast#privacy-mode) is enabled for this destination, prompt and completion content is excluded from traces. All other trace data — token usage, costs, timing, model information, and custom metadata — is still sent normally. Raw provider usage is replaced with `null` and reported as `privacy_mode`, because a provider's usage object can contain arbitrary future fields. See [Privacy Mode](/docs/guides/features/broadcast#privacy-mode) for details.